Kanban Sales Pipeline Templates: Build Your Board in 4 to 7 Columns

A Kanban sales pipeline is a column-based board where cards representing opportunities move across stages, giving your team a visual, low-friction way to track and advance deals. The main payoff is clear visibility into where every deal stands, faster handoffs between reps, and less time lost switching between tools. Below, we walk through setup steps, the metrics that matter, board templates, and a practical look at running this approach inside SoftEXIT CRM’s Status Board.
TL;DR:
- Keep the board to 4 to 7 stages, require value, close date, owner, and next action on each card, and set limits around actual capacity.
- Pilot with one team for about 30 days, review progress weekly, and expand only after checking cycle time, conversion, and data quality.
- Measure cycle time, aging, stage conversion, and pipeline velocity; review cards at or above their limits weekly to identify process, capacity, or data bottlenecks.
- Sort opportunities using deal value, stage, contact recency, and a defined next action; close date alone can elevate old deals that are not genuinely promising.
- Use separate board layouts for fast inside sales, longer enterprise deals, and renewals, whose account health and expansion stages differ from a first sale.
Table of Contents
- What a Kanban sales pipeline actually means for your team
- Core practices: WIP limits, policies, and replenishment
- Step-by-step: set up a Kanban sales board your team will use
- Manage flow and metrics: what to measure for credible forecasting
- Common board configurations and templates
- SoftEXIT CRM: running a Kanban sales pipeline with the Status Board
- Strategies for prioritizing and sorting opportunities within cards
- How to handle and recover from bottlenecks
- Automation for repetitive tasks triggered by board changes
- Tracking board activity history to improve your process
- Customizing boards for different sales roles and teams
- Author viewpoint: adoption habits that decide success
- Try SoftEXIT CRM’s Status Board for your pipeline
- FAQ
- Sources
What a Kanban sales pipeline actually means for your team
In practice, a Kanban sales pipeline turns your sales process into a board where each column is a stage, such as “Qualifying” or “Proposal Sent,” and each card is a single opportunity. Instead of pushing every lead into active work at once, reps pull opportunities forward only when they’re ready, which keeps focus on deals that are actually moving.
Each card should carry a small set of fields so anyone glancing at the board understands the deal without opening a separate record:
- Deal value and expected close date
- Owner and next action
- Last contact date and source
This flow and pull framing, rather than batch processing leads in spreadsheets, is what separates a working Kanban board from a static list dressed up with columns.
Core practices: WIP limits, policies, and replenishment
A board full of columns is just a picture unless you add a few operating rules. Three practices make the difference between a board people check once and one they use every day.
- Work-in-progress (WIP) limits: cap how many deals a rep can hold in an active stage at once, typically a moderate number depending on deal complexity, so attention stays on deals close to closing rather than spreading thin across dozens.
- Entry and exit policies: define what qualifies a deal to enter a stage (for example, a confirmed budget before “Proposal”) and what must be true to exit it.
- Replenishment: a short, recurring check-in where a manager or the rep decides which deal gets pulled into the next open slot.
MIT Sloan Management Review frames this as treating the sales funnel as a flow problem: teams that prioritize and pull the most promising opportunities rather than pushing every lead forward tend to see steadier, more predictable sales cycles. WIP limits and replenishment cadence need local tuning against your team’s capacity rather than a fixed, universal number.
Pro Tip: Start WIP limits slightly tighter than feels comfortable. It’s easier to loosen a limit that’s choking throughput than to tighten one nobody respects.
Step-by-step: set up a Kanban sales board your team will use
Setting up a board that survives past week one comes down to a handful of decisions made before you ever drag a card.
- Map your stages. Keep it to 4 to 7 columns, such as New, Qualified, Proposal, Negotiation, and Closed Won/Lost. More than that and the board becomes noise.
- Decide required card fields. At minimum: value, close date, owner, and next action.
- Set initial WIP limits per stage based on current rep capacity, not an ideal state.
- Define simple entry and exit policies for each column so advancing a card means something consistent.
- Run a short pilot with one team or territory before rolling the board out company-wide.
- Automate data intake where possible and assign someone to own data quality.
A few supporting details make the rollout smoother:
- Build a “My Data” or “My Deals” view so reps see only what’s theirs without filtering a shared board.
- Add a high-value filter so managers can scan large deals across the whole pipeline in one glance.
- Name a data guardian whose job includes catching stale cards before they skew forecasts.
A pilot that runs for about 30 days with one team and a weekly cadence tends to drive adoption faster than rolling the board out everywhere at once, according to practitioner guidance from ChartMogul.
Manage flow and metrics: what to measure for credible forecasting
A board only earns trust once you can point to numbers that explain what’s happening on it. The core set worth tracking on a dashboard includes:
- Cycle time: how long a deal sits in each stage before advancing.
- Aging: how long a card has sat untouched, a quiet warning sign of stall.
- WIP per stage: whether reps are holding more active deals than their limit allows.
- Conversion rate between stages.
- Pipeline velocity: the combined effect of deal count, average value, and cycle time.
Gartner recommends standardizing how opportunities are managed and pairing visual boards with actionable metrics, since this combination of quantitative numbers and qualitative deal notes is what makes a forecast credible to leadership rather than a guess dressed up in a chart.
Poor CRM data quality carries a real revenue cost: 31% of CRM administrators report that it contributes to at least 20% of annual revenue loss, according to Validity’s 2024 research. A dashboard built on stale card data will quietly mislead forecasting no matter how clean the board looks.
Common board configurations and templates
Most sales teams can adapt one of a few proven layouts rather than designing a board from scratch.
- Inside sales: short lanes built for speed, such as New Lead, Contacted, Qualified, Demo Booked, Closed, with tight WIP limits since deal cycles move fast.
- Enterprise or field sales: longer lanes reflecting a slower cycle, such as Discovery, Evaluation, Proposal, Negotiation, Closed, with looser WIP limits since fewer, larger deals sit in each stage longer.
- Renewals and expansion: a distinct board with Health Check, At Risk, Renewal in Progress, and Expansion Opportunity lanes, since this motion tracks account health rather than a first-time sale.
Across any of these, the same filters help: a “my deals” view for individual reps, a high-value filter for managers scanning the biggest opportunities, and an at-risk view that surfaces aging cards before they quietly die.
SoftEXIT CRM: running a Kanban sales pipeline with the Status Board
Inside SoftEXIT CRM, the Status Board gives you this exact Kanban structure natively, so opportunities live as cards you move between configurable columns with drag-and-drop, without opening a separate workflow tool to manage the handoff.
- Columns map directly to your sales stages and can be renamed, reordered, or added as your process changes.
- New records can be created directly inside a stage, so a rep capturing a fresh lead drops it straight into the right column.
- Cards pull in related CRM data, such as contact history and prior activities, so context sits next to the deal instead of behind another click.
- My Data views and dashboards tied to the board surface pipeline metrics and performance information alongside the cards themselves.
Because the Status Board runs on SoftEXIT Studio, stages, fields, and views are configured natively, with no scripting or custom development needed to match your process.
Pro Tip: Configure one pilot board for a single team first. It’s faster to adjust stage names and WIP expectations on one Status Board than to re-train an entire sales org twice.
Strategies for prioritizing and sorting opportunities within cards
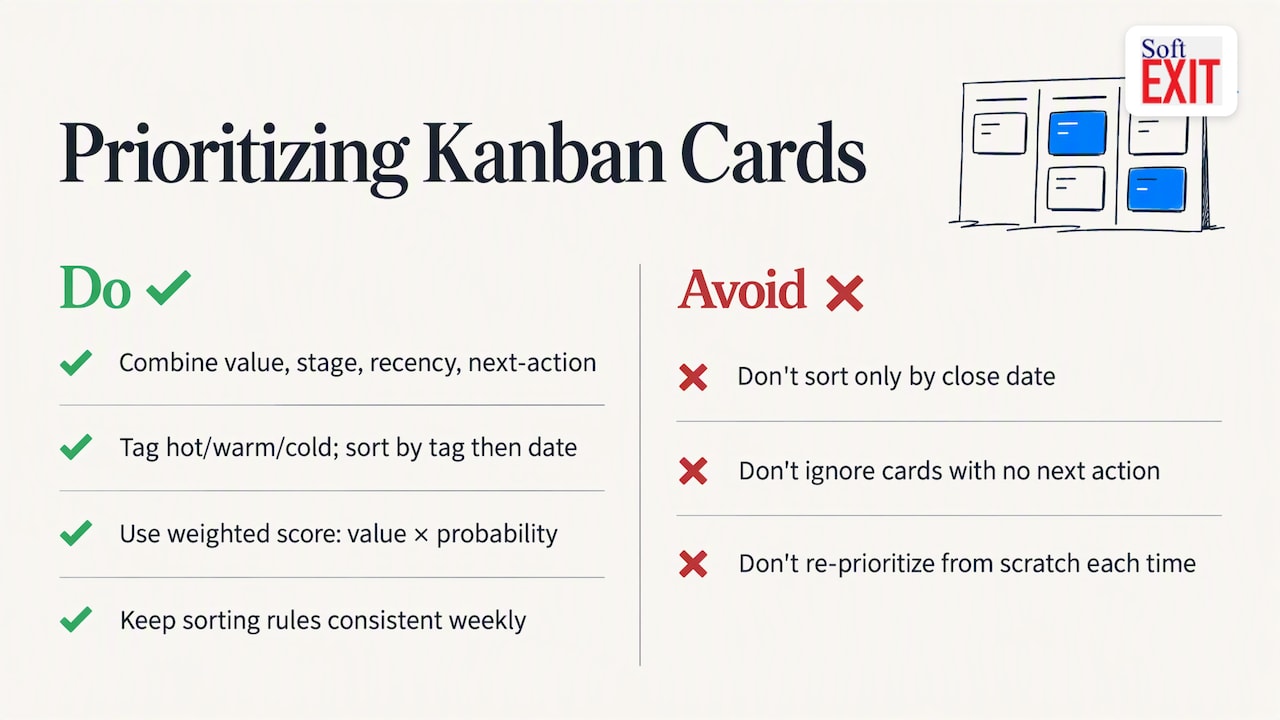
A board with twenty cards in one column is only useful if reps know which three to work first. Sorting by close date catches deals at risk of slipping, but it rewards deals that are merely old rather than genuinely hot. A better approach combines a few signals: deal value weighted against stage (a large deal stuck early needs different attention than a large deal in negotiation), recency of contact, and whether a defined next action even exists. A card with no next action listed is a signal to triage before it is a signal to ignore.
Some teams add a simple priority tag, such as hot, warm, or cold, based on buying signals like budget confirmation or a scheduled next meeting, and sort the column by that tag first and close date second. Others rely on a weighted score that multiplies deal value by a rough probability of closing at that stage, which surfaces the deals worth a manager’s attention without requiring a full forecasting model.
Whatever method you pick, consistency matters more than sophistication. MIT Sloan’s research on sales cycle volatility points to prioritization itself, treating the pipeline as a flow to manage rather than a backlog to clear, as the lever that smooths out erratic sales cycles. A team that sorts cards the same way every week will spot stalled deals faster than one that re-prioritizes from scratch each time.
How to handle and recover from bottlenecks
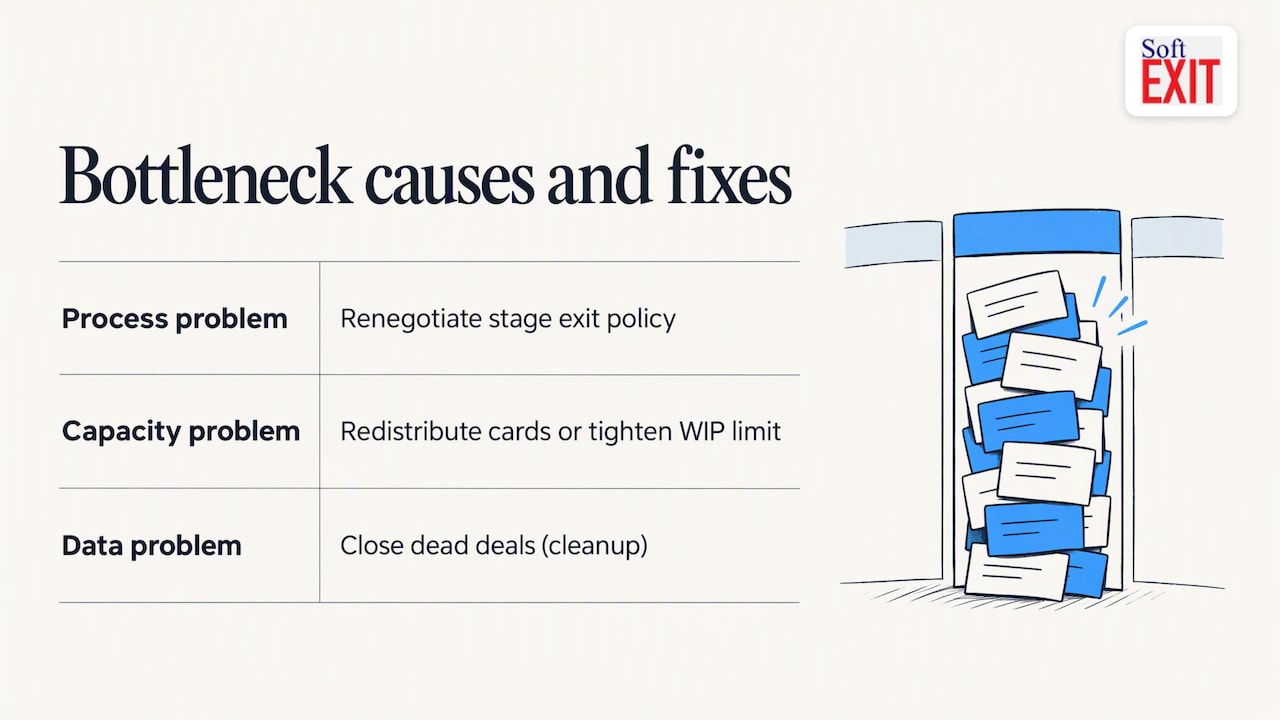
A bottleneck shows up as a column where cards pile up faster than they move out, and the WIP limit you set earlier is exactly what makes this visible instead of invisible. When a stage hits its limit and stays there, that’s the signal to stop adding new cards to it and ask why deals aren’t advancing.
The first step is almost always diagnostic rather than corrective: is the bottleneck a process problem (a required approval that takes too long), a capacity problem (one rep owns too many deals in that stage), or a data problem (deals that are actually dead but were never marked Closed Lost)? Each has a different fix. A process bottleneck often resolves by renegotiating the exit policy for that stage. A capacity bottleneck usually means redistributing cards or temporarily tightening the WIP limit further until the backlog clears. A data bottleneck just needs cleanup, since dead deals inflate every metric downstream.
Recovery works best as a short, scheduled check rather than a one-time fix. A weekly replenishment session, the same one used to decide what gets pulled next, is a natural place to review any column sitting at or above its WIP limit and agree on one action to unstick it. Letting a bottleneck sit unaddressed for a full quarter is how an otherwise good board loses the team’s trust.
Automation for repetitive tasks triggered by board changes
Much of what slows a sales team down isn’t the selling, it’s the administrative drag around it: logging a stage change, notifying a manager, scheduling a follow-up task. A Kanban board that triggers simple actions automatically when a card moves removes a meaningful share of that drag without adding process overhead.
Common automation targets include:
- Notifying a manager automatically when a high-value card enters Negotiation.
- Creating a follow-up task the moment a card moves to Proposal Sent.
- Flagging a card as at-risk automatically once it sits in a stage past a defined aging threshold.
- Updating a related contact or company record when a deal closes, so downstream teams see the change without manual entry.
The goal isn’t to replace judgment with automation, it’s to remove the small, repetitive steps that otherwise get forgotten under a full pipeline. A card that triggers its own follow-up task is a card less likely to go stale, which ties directly back to the data-quality concern raised earlier: automated triggers are one of the more reliable ways to prevent the kind of data decay that erodes forecasting accuracy over time.
Tracking board activity history to improve your process
A Kanban board that only shows the present state of deals misses half its value. The record of how cards moved, how long they sat in each stage, and which ones got bounced backward is what turns a board from a snapshot into a diagnostic tool.
Historical activity data answers questions a point-in-time view can’t: which stage consistently causes the longest delays, whether deals bounced from Negotiation back to Proposal more often this quarter than last, or whether a particular rep’s deals move faster through qualification than the team average. Reviewing this pattern over several months is often more revealing than any single deal review, since it shows systemic friction rather than one-off problems.
This is also where coaching gets sharper. A manager who can see that a rep’s deals stall specifically at the proposal stage, not everywhere, can target coaching precisely instead of offering generic advice. Over time, this history also validates or challenges your WIP limits and stage definitions: if a stage consistently sees cards sit well past its intended cycle time, that’s a signal to revisit the policy rather than blame the rep.
Customizing boards for different sales roles and teams
A single, one-size-fits-all board rarely serves inside sales, field sales, and renewals equally well, since each motion has a different rhythm and different signals worth tracking. Rather than forcing every team onto identical columns, it’s worth building separate boards, or separate views of the same underlying data, that reflect how each team actually works.
An inside sales team benefits from a board with short, fast-moving lanes and tight WIP limits, since their cycle is measured in days. A field sales or enterprise team needs a board that reflects a slower cycle with more deliberate stages, like Discovery, Evaluation, and Procurement, where a looser WIP limit makes sense because fewer, larger deals are in motion at once. A renewals or customer success team needs an entirely different vocabulary: Health Check, At Risk, and Expansion lanes rather than a first-sale funnel.
Role-based views matter just as much as stage design. A rep should see a board scoped to their own deals by default, while a sales manager needs a rolled-up view across the whole team or region. Building these as separate, purpose-built views rather than one overloaded board keeps each group focused on what’s relevant to their job without wading through noise that belongs to someone else’s pipeline.
Author viewpoint: adoption habits that decide success
The boards that last share a few habits, not a specific software feature. Start with one small pilot and actually measure cycle time and conversion before expanding. Assign a data guardian and automate intake early, since a board fed by stale, manually entered cards collapses under its own inaccuracy. Keep replenishment and coaching sessions short and weekly. Teams that treat the board as a living process, not a one-time setup, are the ones still using it a year later.
— James Edgell
Try SoftEXIT CRM’s Status Board for your pipeline
We built the Status Board inside SoftEXIT CRM so your sales process doesn’t have to bend around rigid, pre-built stages the way many traditional CRM platforms force it to. You get configurable columns, drag-and-drop cards, and dashboards that surface pipeline metrics right alongside the board, all tailored to your stage names and fields rather than a vendor’s assumptions about how you sell.
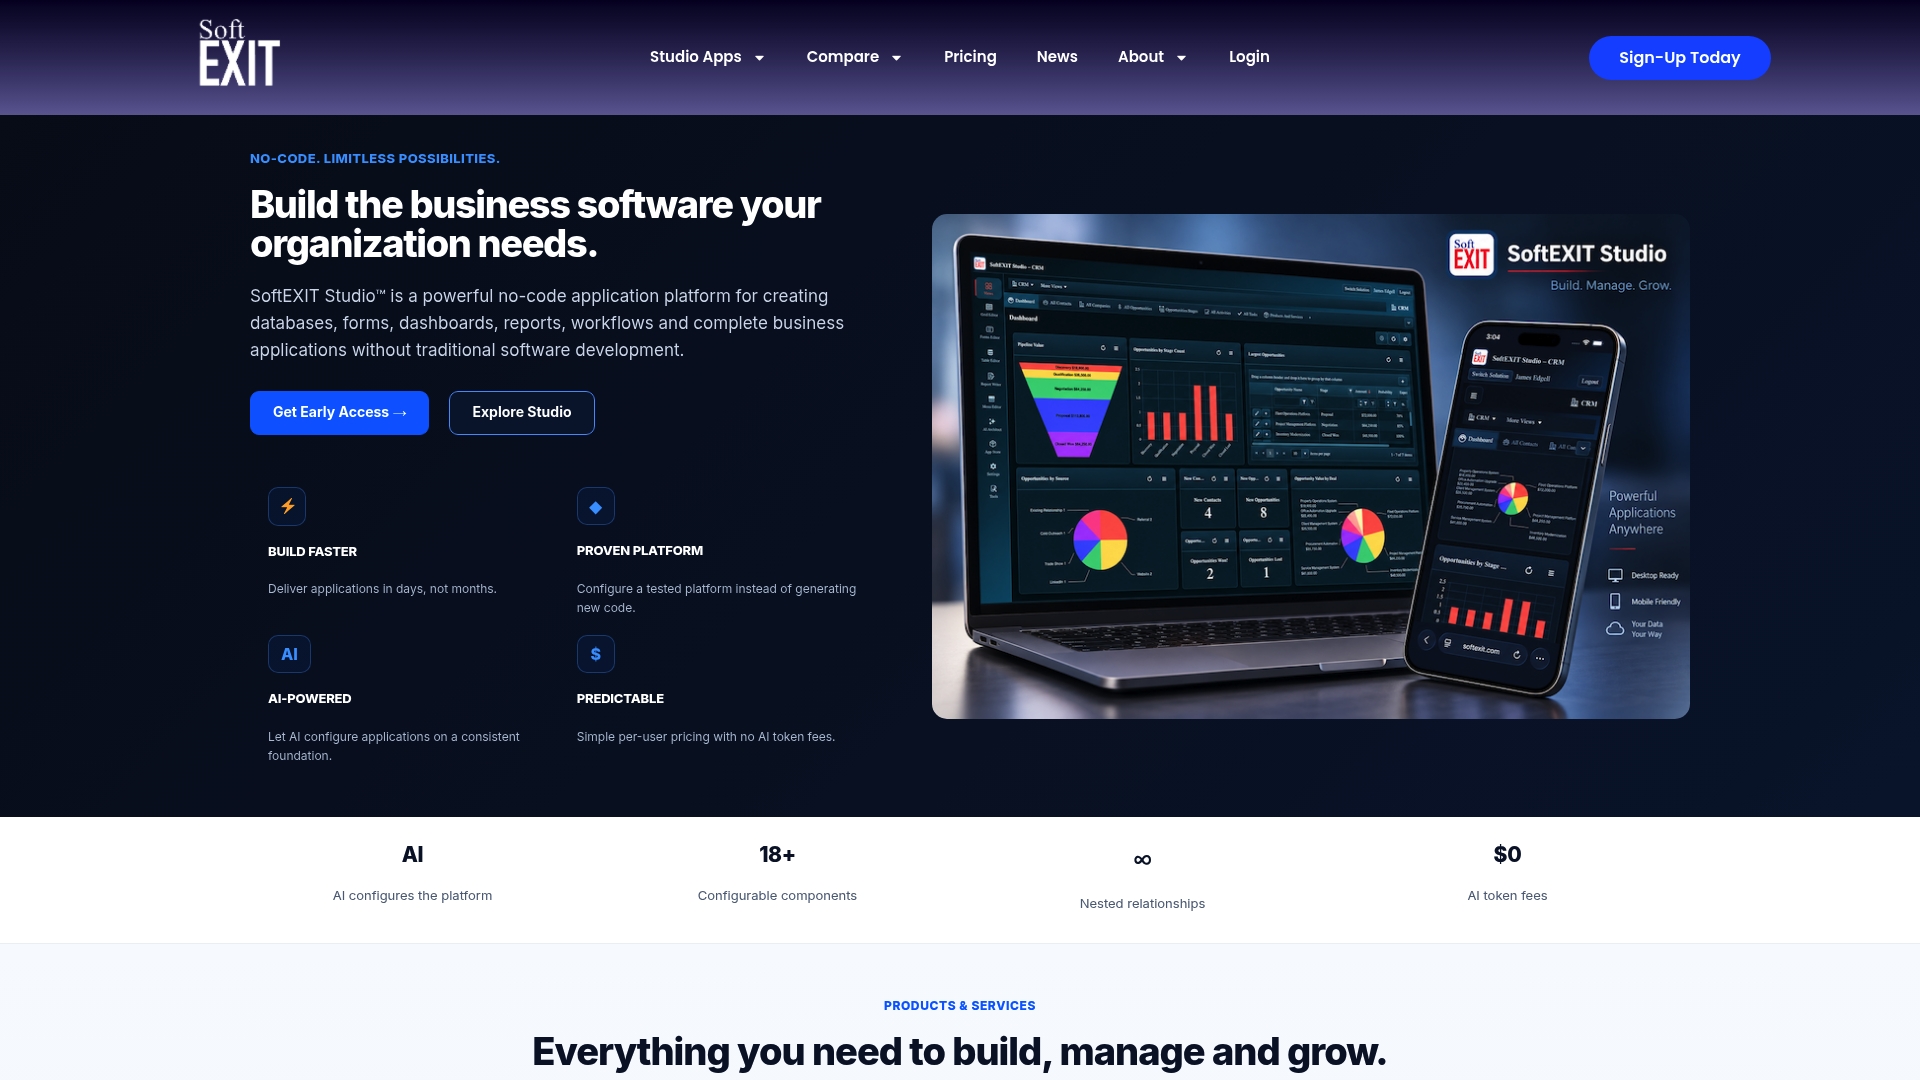
Alt text: Sales manager viewing a configurable Kanban Status Board with deal cards and pipeline dashboard in SoftEXIT CRM.
Because the Status Board runs on SoftEXIT Studio’s no-code configuration tools, your team can adjust stages, fields, and views natively as your process evolves, with no scripting or developer time required.
- Opportunities move between fully configurable columns with simple drag-and-drop.
- New records can be added directly into any stage without leaving the board.
- Related CRM data and My Data views keep context next to every card.
Our onboarding resources, including walkthrough videos and a short pilot program, help your team get a working board live in days rather than months. Visit the SoftEXIT CRM product page to see the Status Board and start your pilot.
FAQ
What is a Kanban pipeline?
A Kanban pipeline is a visual sales board where each column represents a stage in your process and each card represents a single opportunity. Reps pull cards forward as deals progress, which keeps the focus on active, qualified work rather than every lead sitting in the system at once.
What are the five stages of a sales pipeline?
Stage count varies by team, but a common five-stage layout includes Lead/New, Qualified, Proposal, Negotiation, and Closed Won or Lost. Many teams adjust this to 4 to 7 stages depending on deal complexity and sales cycle length.
What are the WIP limit rules of Kanban?
Kanban’s core rule is capping the number of items allowed in a stage at once, known as a work-in-progress (WIP) limit, so teams finish work before starting more. There’s no single universal number: limits need tuning to a team’s actual capacity and replenishment cadence rather than a fixed formula.
What is the 10-3-1 rule in sales?
The 10-3-1 rule is a sales qualification heuristic suggesting that a portion of leads become qualified opportunities and a smaller portion close, though actual ratios vary widely by industry and deal size. It’s used informally to set expectations for pipeline volume rather than as a fixed target.
Does managing a Kanban sales pipeline require a complex workflow engine?
No. A structured sales pipeline can run on a visual board with configurable stages, WIP limits, and simple automation triggers, without a heavyweight workflow engine behind it. Tools like SoftEXIT CRM’s Status Board use no-code configuration to support this structure natively.
Sources
- The State of CRM Data Management in 2024 — Validity
- Taming the volatile sales cycle — MIT Sloan Management Review
- Use analytics to improve pipeline management and sales forecasting — Gartner
- How to use kanban for sales opportunity management — ChartMogul