Views & Reporting
Design Grids, Status Boards, Reports, Dashboards, and navigation.
Build Dashboards with Charts and Gauges
Combine Charts, Gauges, and Grids to answer business questions.
Organize Navigation with the Menu Editor
Configure your Solution navigation and Access Group visibility.
Create Grids and View Components
A View is a user-facing screen. A View can contain one or more reusable View Components such as Grids, Forms, Charts, Gauges, and Status Boards. Open Views to work with the configured application and use the relevant editor or View configuration controls to compose the screen.
Build your first data Grid
- Choose the Table whose records the Grid will display.
- Add the fields users need most often and arrange them sensibly.
- Configure sorting, filtering, paging, grouping, and summaries as appropriate.
- Attach the correct data Form for adding or editing records.
- If the Table has children, create a related child Grid and configure it to listen for the parent selection.
- Save the layout and test with multiple records.
For example, a Companies Grid can show Contacts, Opportunities, and Activities in related child Grids. When a user selects a different Company, the related records should change to match.
Try a Status Board
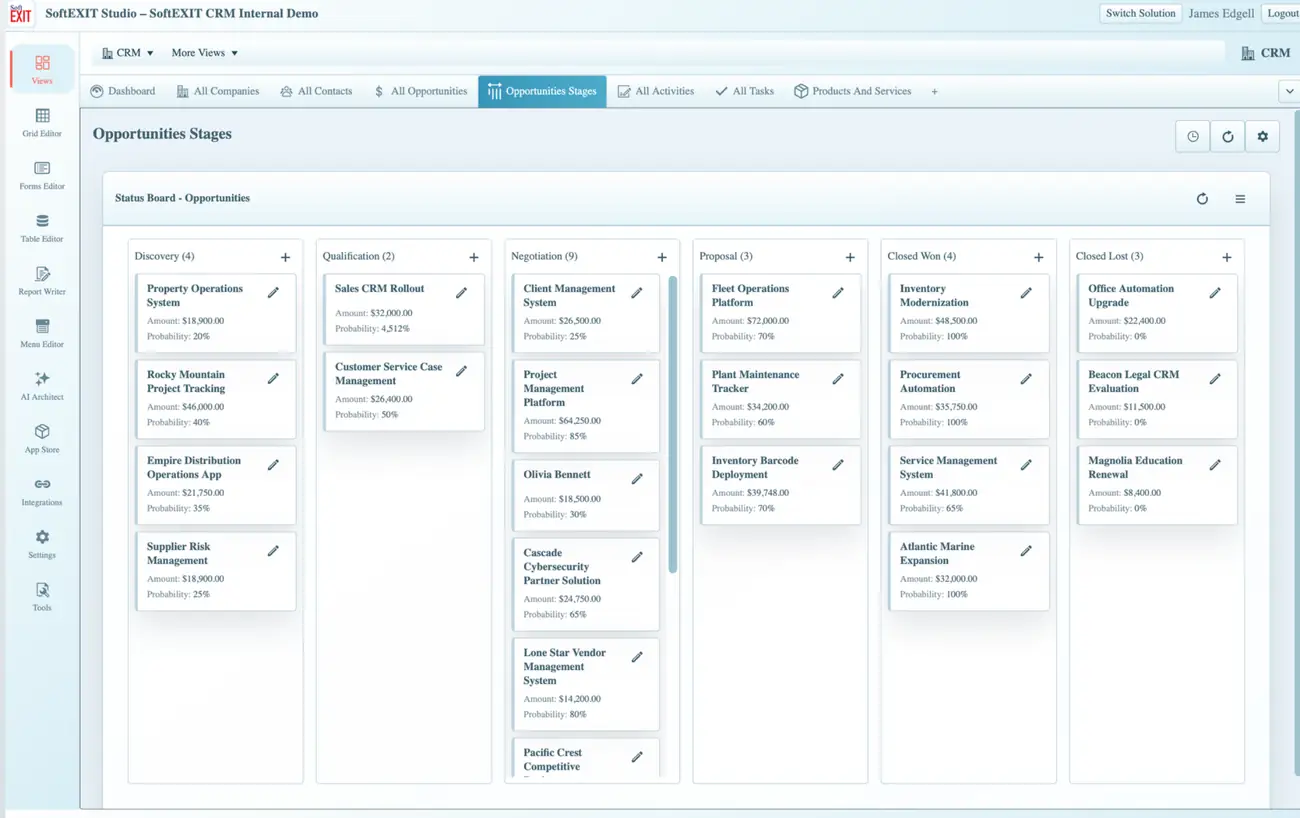
A Status Board organizes records into visual columns based on a status or stage, such as Discovery, Qualification, Negotiation, Proposal, Closed Won, and Closed Lost. Where allowed, users can edit cards, drag cards between columns, or use a column’s + action to create a record already assigned to that status. Designers can configure read-only behavior or disable dragging.
Use the Report Writer
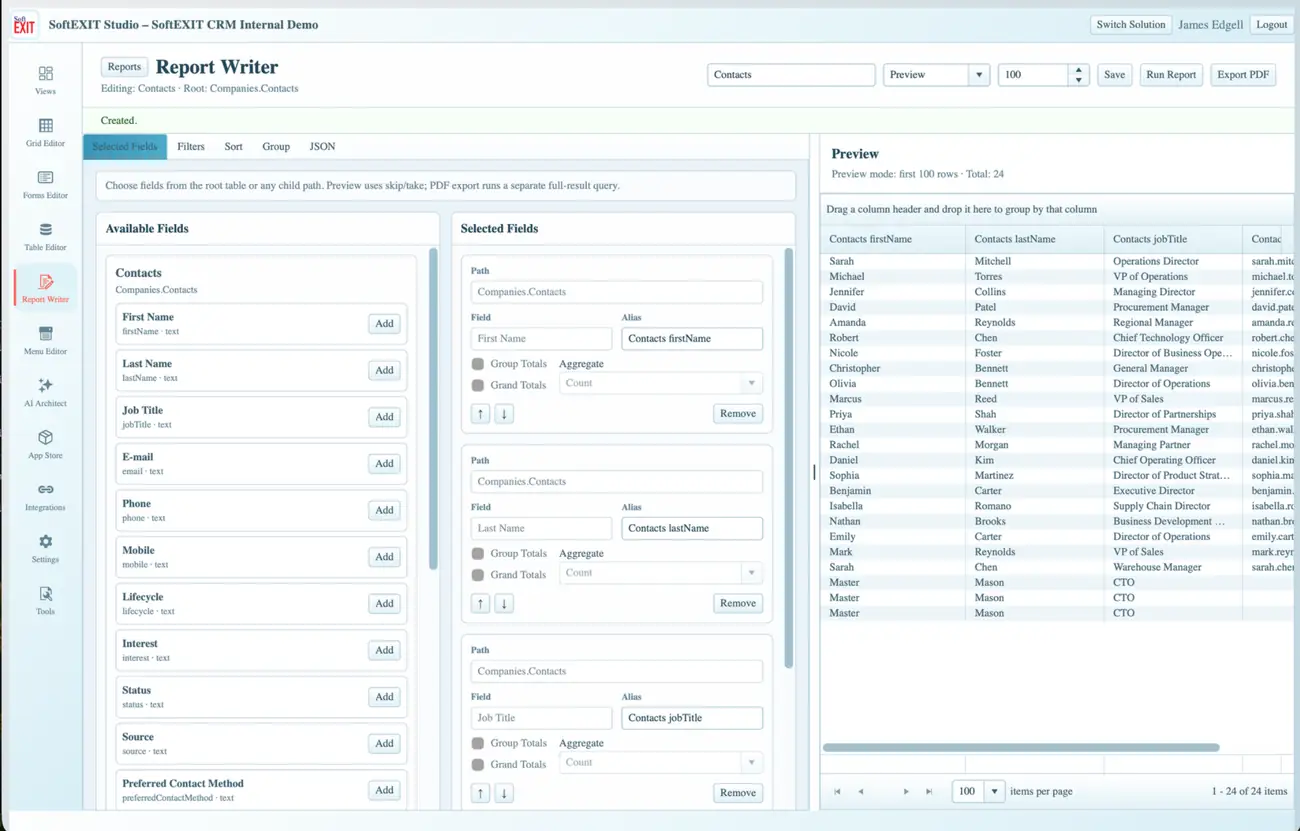
Open Report Writer and create or select a Report. Choose the root Table to determine the dataset. A child Table may appear under its parent path (for example, Companies.Contacts). The left side lets you configure the report, and the right side displays a Preview.
Create a Contacts report
- Choose a report name, such as Contacts by Company.
- Select the relevant root Table in the Table tree.
- On Selected Fields, add First Name, Last Name, Job Title, Email, and other needed fields.
- Adjust each field’s display alias, if desired.
- Use Filters to narrow records, such as activity during a date range or a selected status.
- Use Sort to define the order and Group where useful.
- Configure supported Group Totals or Grand Totals, particularly for numeric fields.
- Choose Preview, select the preview row count, then click Run Report.
- Save the configuration. Use Export PDF when a downloadable document is needed and permitted.
Preview versus exported report
Preview is designed for interactive inspection of a limited number of rows. PDF export uses the report configuration for its output. Check field widths and grouping so the exported document remains readable. Use descriptive report names so teams can distinguish similar reports.
Build Dashboards with Charts and Gauges
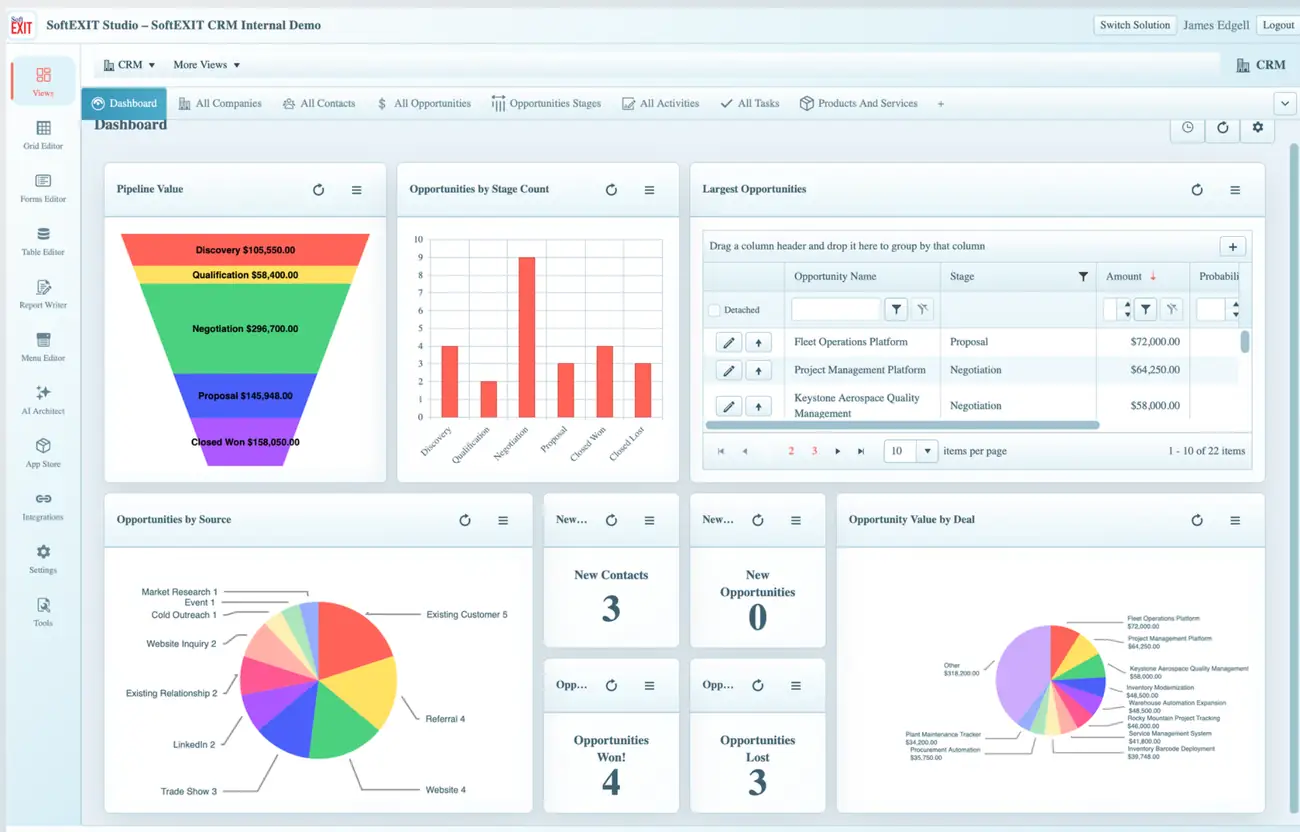
Dashboards combine several components into one practical overview. Start with a question your users need answered—for example, How much pipeline value is in each stage?, How many opportunities are open?, or Which deals are largest?. Then choose suitable Charts, Gauges, or a Grid to answer it.
Suggested first dashboard
- Create or reuse a View dedicated to your dashboard.
- Add a Chart for records by Status or a numeric amount by Stage.
- Add a Gauge or single-value indicator for an important KPI.
- Add a Grid for records that need attention.
- Choose fields, grouping, and calculations appropriate to each component.
- Arrange and size the components so the most important information is prominent.
- Save, open the View as a normal user, and confirm the numbers reflect current records and access permissions.
Studio supports multiple chart series, totals, and different visual component types. Use a clear title for every widget and avoid overcrowding the page with metrics that do not lead to decisions.
Organize Navigation with the Menu Editor
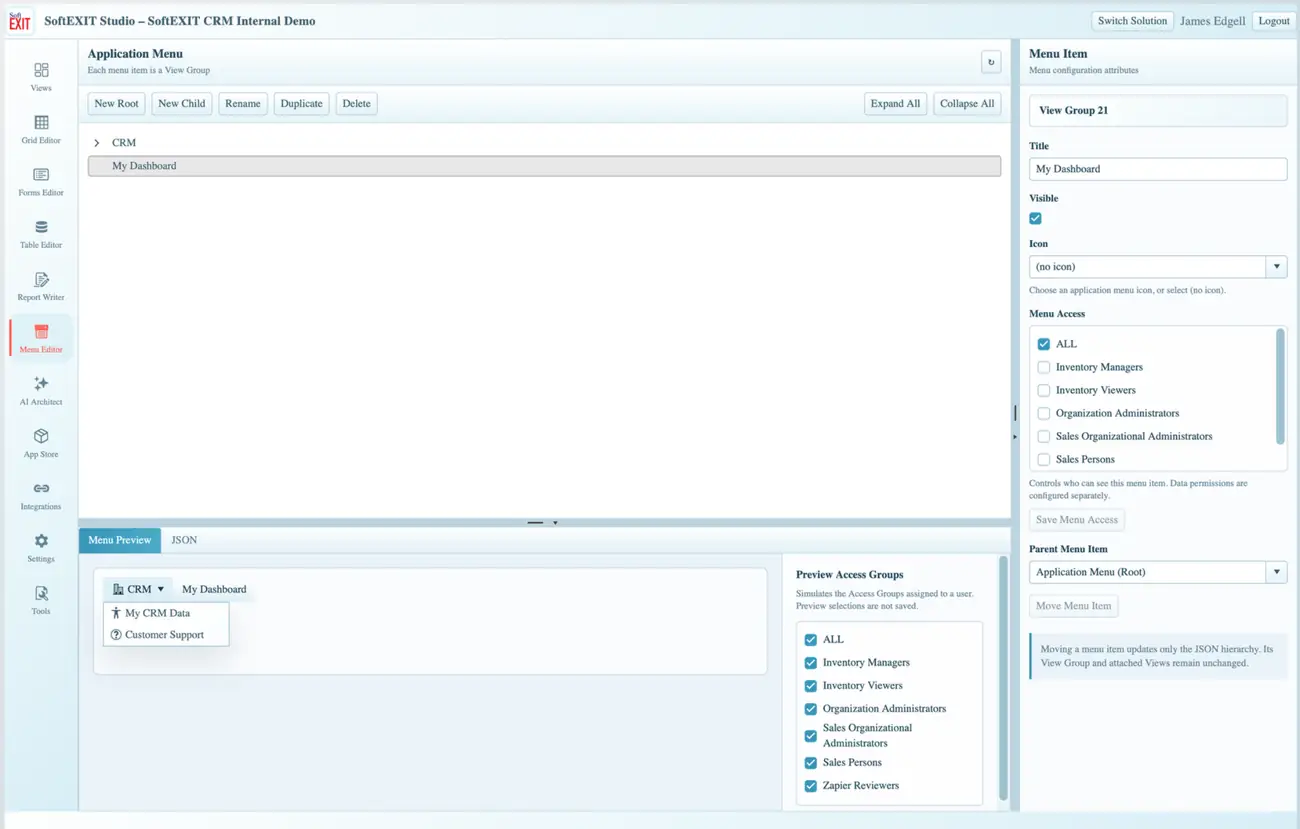
Open Menu Editor to control how people find your Solution’s Views. The application menu can contain root items and children. The preview area shows how the menu may appear after configuration, while the right panel allows editing the selected item’s Title, icon, visibility, parent, and Menu Access.
Create a logical menu
- Select a menu item or use New Root / New Child to organize the structure.
- Set a brief user-facing Title and choose an Icon where useful.
- Link the relevant View Group or navigation entry as supported by your current configuration.
- Choose the Access Groups that should see the item.
- Use Menu Preview and its Access Group simulation to review the layout.
- Save the changes and open the Solution as a user to confirm its navigation.
Important: Menu visibility alone is not a data-security boundary. Verify Solution, View, component, and Table permissions separately. Parent menu visibility can affect access to child navigation.
More SoftEXIT Studio Help
Use the Getting Started index to explore other subjects.